Product Platforms

Considering the value of Product Roadmaps combined with normalized cost and profit curves
(Post 12)

A company eyeing your startup for purchase, or venture capital representatives with technical and commercial backgrounds, will want to discuss the nature of your product development decisions and how they relate to solving your customers’ problems.  They may have a hole in their product development roadmap, and they can buy your company instead pursuing the research and development, engineering, commercialization, and production introduction costs.  More and more companies don’t invest in internal R&D but rely on venture capital and government funded systems to innovate and assume risks for them.  This behavior reduces their risk of buying a correct, durable, sustainable, and reliable solution that meet their customer’s needs.

When this conversation happens, you will be ably equipped to discuss the future of the solution, with your Roadmaps and future generations. But you will also need to incorporate the impact of future generations on the cost projections as well.

If you look at the roadmap, you’ll see that each generation is adopting technologies, likely across multiple functions including hardware, software, process, and test and measurement. Each new technology makes improvements to meet increasing performance requirements and cost reduction pressures from competitors and consumers.  There is also the inconvenience of maintaining Gross Profit Margin through generations, and control Contribution Margin [or what’s left after covering expenses (variable costs) related to production and sales], and then covering the expense of maintaining and running the business.

Product as Platform

Careful design of the product future, marketplace changes, and the product, testing, and process roadmaps naturally lead to the introduction of a platform, where each new technology brings planned improvements and meets customers’ current and future demands. A platform expects the orderly inclusion of future technologies, even when future technologies are murky.

Back in Post 5 [link], we explored the concept of Normalized Cost, and the effects of time and the product life cycle on cost and profit. I introduced this diagram showing how normalized cost typically decrease over the phases of the product life cycle, while the profit margins increase. Both curves change drastically once product retirement phase is reached.

Now that we are visualizing the product as not just a single entity but actually a platform for ongoing improvements and future generations, let’s consider the impact of these future generations onto our Normalized Cost and Profit curves.

Product Roadmaps contrasted to Generational Normalized Cost and Profit

A successful platform design results in a decreasing normalized cost per unit and maximized profit margins over the life of the product platform (not just the Gen 1 product).

Intrinsic Cost

While I don’t want to spend a lot of time on a new concept, it’s worth discussing. The new concept is one that I call Intrinsic Cost, which has to do with Normalized Cost. A generation’s normalized cost is not set, but is related to the roadmap, design, and process decision at the generation’s inception (called this the design direction). It has been said the 80% of a product’s normalized cost is designed in from day one. As one gains experience in product development, you’ll understand that engineering solutions can swing from the mechanical domain to the electrical domain to the firmware/software domains to the controls/metrology domain, and back again. It’s a matter of dollars and cents, available technologies, and forecasted production volumes to solve problems the customers want solved, on time and at cost (this then extends to price).

Normalized Cost based on Roadmap and Product Life Cycle Decisions

Above is an example of three normalized costs to achieve the same customer experience.

Normalized Cost 1 relies on leveraging a lot of legacy design and supply chain resources, basically making software improvements and some minor usability changes; it always has the highest cost but has the shortest time to market.

Normalized Cost 2 made several improvements in software and performance because of available low-cost processors and memory upgrades, and tapped into some supplier improvements to lower hardware costs.

Normalized Cost 3 does it all, abandons platforms and invests in new hardware and software, but it takes longer than Normal Cost 2’s design direction to achieve lower costs, and costs more, longer because of developing a new supply chain and production capabilities, and requires the highest production volumes to offset all these investments.

The lowest normalized cost is not always the best intrinsic cost target. For example, to achieve Normalized Cost 3 is based on technology and development efforts that will take the same time as a competitor to introduce two generations. Hence, the lower cost may not be worth the opportunities lost. Or if the production volumes are moderate and the planned product life cycle is shorter, maybe choosing the design direction of Normalized Cost 2 is correct. If you’re trying to hold a market position until a new platform is ready, Normalized Cost 1 is the safer route.

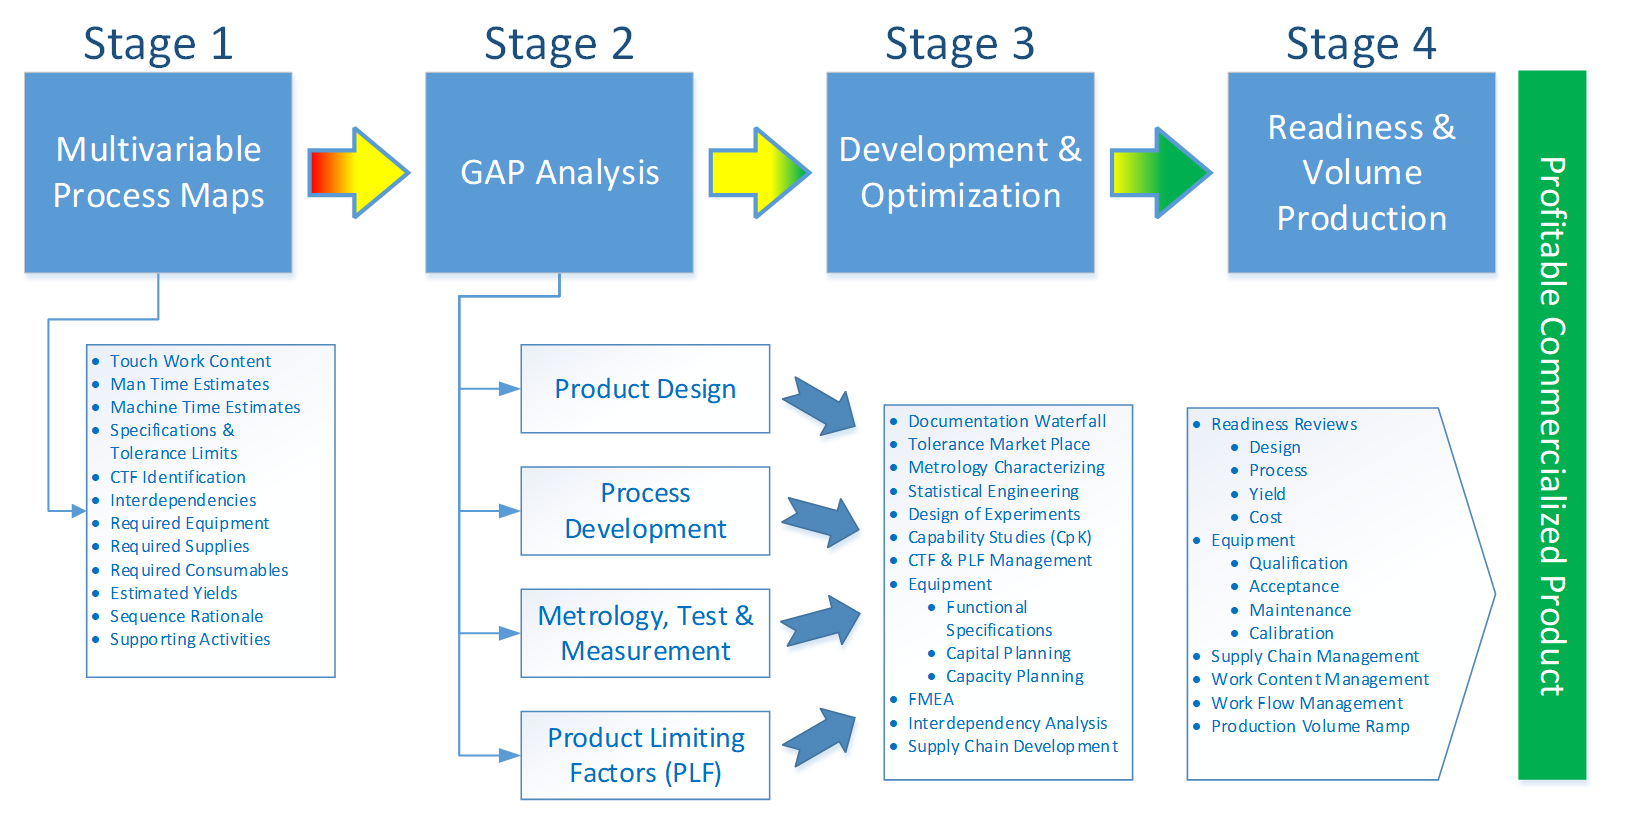
At this point you must be wondering what happened to my beloved process maps. I’ve not forgotten them, and upcoming entries will dive into the next steps in using them. I figured that readers would want some exciting background on why I always start with process maps. The basic premise is that without someone in the organization thinking about design direction, normalized cost, and the eventual chosen intrinsic cost to meet market demand at cost (price and profit) and ensuring the shortest Time to Profit, your hard-tech product will lack what it takes to make it to commercialization and profitability.

Keeping an Eye on The Next Generation

Using Roadmaps to smooth the road to the future
(Post 11)

In this chapter we introduce Roadmaps and other techniques to minimize making design decisions now that will limit the next generation of your product. (If none of the Gen1 technology can be used in Gen 2, then you’re starting from ground zero!)

Early on I figured out that one might not want their startup to be a one trick pony, with one product, hopes and prayers.  Again, I’m being direct for a reason.  Not all hardware startups get bought, and you may have to run your company, manage operations, accommodate returns, deal with customers and continue to understand the evolution of their needs, and because of financial and market pressure, to ship a Gen 2 product sooner than you could ever imagine.

In general, considering your next product is never a bad idea.  Investors will want to understand your vision of how your product and technology will continue to generate revenue. Suitors who are looking to acquire will want to know the path to future versions as well.  So in summary: you may think you’re taking your on current product vision, but you’re taking on the future too.

The decisions you make during the design of your first product will have profound impact on the future iterations of the product. This is true whether it is the first generation [Gen 1], or a derivative of an existing product that you’re redefining or focusing on a new application or solution [Gen x].  I understand that there are many decisions, constraints, and boundaries just to get something out the door. But sometimes the most hastily made (and seemingly insignificant) decisions are the ones that come back to haunt you when planning a future version of the product.

So beware: the future is now, at least when it comes to making design decisions. Keeping fundamental design intent in clear view is critical to minimizing decisions that will have a limiting effect on future products. Why am I bugging you with future considerations, roadmaps, and platforms?  I could be cheeky and say, “someone has to”, but I won’t be a wise ass.  The first technology solution is not always the best choice required to stay ahead of the competition with confidence, from a scalability and future product variations point of view.      

 The fundamentals guiding you to future-proof decisions

While it is very difficult – I hesitate to say impossible, but it’s close – to understand the future implications of every design decision, there are a few concepts that pave the way to a clearer vision of the future of your product, and they are:

  • Design Intent

  • Families of Variations

  • Product Roadmaps

Design Intent is the basic understanding that the combination of the components should meet the performance expectations that a customer wants.  To dissect this definition, this means you need a rock solid understanding of two things: the customer’s expectations, or the exact functionality and performance to be delivered; and the capabilities of each of the components as configured, assembled, processed, and tested, in the context of this product. This is discussed further in Full Arc Blog Post 8, but the basics bear repeating:

Once the Design Intent fundamentals are determined, it is then possible to describe and understand the potential deviations of performance. The potential deviations can come in many shapes and sizes, and may require you creating a new parametric frame of reference or measuring system. This range of potential deviations are known as Families of Variations.

I believe strongly in managing risk by understanding Families of Variations.  The Families of Variations will depend greatly upon the nature of your product, the underlying technologies, the materials and components used, the assembly and other processing, and testing.  They could be measurable (e.g., size dimensions, electrical parameters) or rely on visual inspection; they could be testing of individual subcomponents, but also they can require testing of partial or fully assembled units; they could require external stressors in a testing configuration (like temperature or humidity). Some Families of Variation will be more subjective than others, but repeatability and clear tolerances will always lead to better decision making. Finally, Families of Variations follow two basic tenets of nature:

  1. The whole is the sum of its parts. That is, variation in a component means variation in the final product, so, risk in a component means risk in the final product.

  2. The “80-20” Rule: 20% of the Families of Variation have 80% of the effect on product performance.

Families of Variations can be used to describe processes and test plans as well as product components. The more fully Families of Variations are understood, the less likely unexpected defects will appear, particularly as volumes increase.

Fundamental to the evolution of the Families of Variations is understanding knowns, and how knowns are few in the beginning, and need to be captured and controlled.   Some knowns are relatively easy to capture and we can use calibrated test and measurement equipment, materials, and supplies with certificates of conformance, and well understood roadmaps.  See Full Arc blog Post 6 for more on Knowns and Unknowns in understanding risk.

 Understanding Roadmaps

Maybe you didn’t notice that we slipped Roadmaps into our list of Knowns. Wait, are Roadmaps a known?  Sure, because they are known if they are well researched, curated and kept fresh.  This work takes effort, networking, and vision.  But roadmaps can guide current and future Product Life Cycle (PLC) and Platform decisions, with the best consolidated and validated information available.  Like process mapping, developing these roadmaps can be part of team building and aligning communities within a company to the common goal, minimizing Time to Profit and shipping your first product or service.

Roadmaps General Definition:  A Roadmap is a graphical representation of Product Iterations [Generations] mapped to Available Technology Iterations, within a Product Platform.  The sample below shows the best estimate of technology development for a given roadmap.

The arrows on the right represent underlying behaviors and expectations associated with a platform’s PLC. Overtime, performance and perceived value must increase. Markets and competition require intrinsic cost reductions through supply chain management, yield improvement, and operations continuous improvement that can harvested generationally and retained. Profits and margins must overtime be maintained at acceptable levels.

Basic usage and interpretations: 

In product and process development, roadmaps are used a backdrop or basis to assess the inherent risks of various design and process decisions.  One cannot assess and quantify risk unless there is a basis from which to objectively measure risk against.  Roadmaps provide the best estimate for these areas of interest.

Development of roadmaps for new products and maintenance of roadmaps for existing products are a primary goal of a product team, even before your first early product build attempts.  A product team would include representation of research, development, marketing, operations, supply chain, quality, reliability or compliance, and sales.

Roadmaps are a consensus of best estimates and guesses of what is needed (Marketing) and what can be used to fulfill the need (Product Design/Process/Supply Chain/Test).

If the world was a perfect place, the Available Technology (Tech A, B, C, D) would map to the Generations (Gen x, x+1…).  In practice, rarely does this happen.  Hence, decisions must be made based on performance required and risk.

For example, let us look at Gen x+1 and Gen x+2.  Tech C may actually be available for Gen x+1.  A risk decision must be made whether to pull it in to Gen x+1, with the subsequent refocusing of resources, or let the potential gains pass onto Gen x+2.  Customer requirements, cost, and lead-times to production fulfillment are a subset of the driver factors.

Another example is whether Tech D will be mature enough for the Gen x+3 product, or will Tech C have to be extended into Gen x+3?

Lastly, what if you find out from your customer that Tech E is the only enabling technology to achieve performance in Gen x+3?   What if Tech E does not fit in the current technology or process platform?  Is this the time to abandon the “Gen” Platform, and start a new platform?   The only good news according to this diagram, is that Tech E will be available; but who can trust suppliers that far out?

Actual Usage by Generations (Shown with Hatches)

From the usage diagram, one can see the Tech D was abandoned and the team jump to a new platform with Tech E.  Again, this decision could be driven by performance, cost, or supply chain production capacity constraints.  It’s best to understand these changes early to have appropriate research and development resources applied to ensure the intersection happens on time.

Types of Roadmaps: 

Often roadmaps are thought of as Product Roadmaps.  But in reality, high production volume industries use roadmaps for manufacturing, automation, test development, data system integration, and supply chain development.   There should be multiple roadmaps for each area of interest, having one for each function or component.

In modern, outsourced products, all these factors are considered and sequenced in PLC (Product Life Cycle) and PLM (Product Line Management) decisions.  Basically, in high volume commodity-like markets, there is no use in committing to a price at volume target if it’s not supported by the reality of these roadmaps.  The market will choose someone else.

Often test technologies are ahead of the product technologies because of the requirement to capture an event at a sufficient resolution to determine pass or fail.  This is the case with integrated circuits and smart devices like sensors.  Data roadmaps determine the total cycle times on automated test, as much as the actual test cycle time.  Data latency in configuration management and final test can cripple high volume production, particularly during a self-test’s result download and post process analysis.

I hope you’re enjoying the increased vision and risk reduction that advanced process mapping deliverers.  I figure your mapping discovery and creation work is still digging up critical content, and some GAP analysis has started.  Technical and Process professionals usually can’t help themselves.  Roadmaps are another tool to capture possible ways of improving performance, increasing features, while reducing product cost to maintain profit margins.   You can use your process maps to model new possible generations, and assess cost and risk.

How do these roadmaps relate to the original normalized cost and profit margin curves introduced in Chapter 3?   We’re going to chat about that in the next chapter.

Looking into the Future

Modeling the Outputs of the Multivariable Process Map
(Post 10)

In the previous three blog entries, we have discussed the basic construct of process and theory around multivariable process maps. Each operation in a multivariable process map has labor, a cost, and in some cases, a yield.   In this chapter we are going to use a simple example process to introduce how product development, process and manufacturing development, operations, and supply chain can use the multivariable process map to start to understand how decisions are shaping the overall cost and required resources to realize your hard-tech product.     

Here is the basic process map construct for reference.

A sample process for a sample product

As an illustration of these techniques and principles, I have created a process that we can refer to. (Eagle eyed blog fans may recognize this sample; it was attached to the previous chapters as a liked Excel Process Map to download and edit.) The idea was to make it simple, but realistic enough for scenario modeling and problem solving.   

The 10-step process creates a fictional product, a Low Frequency Acoustic Absorber that is intended to improve the performance of micro-subsonic detectors, for home seismographs.   Our “research” and the development of our Marketing and Product Requirements Document determined that low-cost detectors could be used if there was better absorption of sound in these frequencies.  Californians and residents of other earthquake-prone areas have demanded this low-cost in-home capability for years, allowing them to quickly determine if evacuation is needed, and to configure their survival packs depending on the severity of the event.   Micro-subsonic detector system providers are looking for new markets, but without our product, they cannot meet the selling price point with their more expensive detector.   With our technology, they can leverage older technology.

The key technology driving this product is the sensor that makes up the fictional low frequency acoustic absorber, made up of a small, printed circuit board. They will be produced on a wafer “substrate” that holds 50 of our devices, laid out in a 5x10 matrix. Later in the process, the wafer will be “diced” or cut into pieces to make 50 individual units.

Micro-subsonic detector at wafer and device levels

The basic steps for production will be to prepare and clean the substrate, to carefully position the microfilm for “printing” and lamination, dispense a polymer adhesive material, cure, test, and dice. As in any PCB or microelectronic assembly process, each of these steps has a very particular set of parameters that can greatly influence the outcome and success of the final product, so precision is of paramount importance.

Market Demands for our fictional product

Our customer projects the following demand and target pricing for the product:

Quantities and Demand per Period and Target Device Cost at Volume:

Our constraints are:

  • The finished Sensor Devices per current substrate size: 50 absorbers.

  • The target cost is $4.50 per Sensor based on marketing and systems’ requirements, and the actual starting cost based on preproduction values is $16.50 per Sensor.

  • For the system to be profitable, the breakeven cost is $10.00 per Sensor, the team is committing to that goal by Q1-2024.

  • Labor is fixed regardless of substrate size, and substrate cost increases 0.25 times for every doubling of area. 

Q3-FY2023 Starting Multivariable Process Map

What do we get for our Multivariable Process Mapping efforts?

Coming up with, reviewing and revising, and verifying the information in our Process Map is a substantial effort. But lots of useful benefits roll out of the model. The first thing we get is a quantitative visualization of our process and how our design could be built.  In manufacturing lingo, this is a routing.  The second thing we get is an estimation of the materials used.  In design and manufacturing lingo, this is Bill of Materials or BOM. 

We can also extract critical information around the cost of materials and supplies, Costed Bill of Materials.   The total labor involves manufacturing a device and the total time required to manufacture as device, or the Cycle Time.   We can also determine the total cost for equipment.

Let’s take a look at the outputs from our model for Q3-2023:

From a commercialization perspective, this may be your first view of critical factors that will be the foundation for manufacturing your product.   You now know that you need ~40 minutes (0.67 hours) to manufacture a substrate.  Your theoretical cycle time is ~180 minutes (3.00 hours). 

Scaling Up

Over time, we expect volume will go up and price will go down. Even at this early stage, we can project the timeline for the expected volume changes and the target pricing, but we need to plan what technical or material improvements will lead to those cost reductions. Price breaks from material suppliers as volume goes up and yield improvements as our manufacturing process stabilizes will be contributing factors, but to make further cost reductions, we need to look to what other improvements can be made, such as automation.

Target Device Cost at Volume:

Click on this figure to access the fully developed Multivariable Process Map (Post 10 Process Map Example)

If you download the full spreadsheet of our sample Process Map, you will notice worksheets for these future quarters. Click the tabs to see the Process Maps as they change over time (highlighted in Yellow), allowing us to see these detailed cost and yield projections for the future.

Understanding yield

In a subsequent entry, we will spend some time on the finite capacity and planning.  But for now, let’s concentrate on yield and its huge impact on labor and material cost.

Often when training new operations teams at startups, the team mindset is optimistic.  Usually after a few workshops and sessions we can come to agreement on the basic labor and materials.   Usually, individual operations can be demonstrated successfully. But when I asked if the operations can be performed in the proposed sequence, silence ensues.   Crickets.  I usually push and ask what happens, almost always they describe a situation where no product makes it through all the processes, or the product that makes its way through fails for some basic parameter or specification.  Or I get the answer that “Bill the Technician” can get stuff to pass if it’s a Tuesday morning with a waning moon, but no one else can. 

This is yield.  Yield can be called many things.  For example, in traditional quality theory, yield is related to Percent Defective (p’), whereas Yield is equal to 1-p’.  If you have 10% defective, you have 90% yield.  In the world of traditional Statistical Process Control, the factor CpK or process capability coefficient can be related to Z-Scores (Normal Distribution) and Part per Million (ppm), both which represent p’.

In rolled yield modeling, or single piece flow modeling, which is common in Hard-Tech, time is constant.  What this means is when time is consumed, you lose it forever.   In the extreme situation above with Bill the Technician, nothing is passing the quality inspection required.  In a more realistic situation and usually the outcome of the additional workshops, we learn that there is actual one or two operations or tests that cause the huge yield impact.   Usually, we find a process that lacks process capability, the design lacks performance margin, and a test station that lacks repeatability and reproducibility. 

Remember we constrained this discussion saying time is constant.   Why?  We want to understand the theoretical model and the actual.   If you consider our absorbers, our Rolled Yield is 75%.  In real world that means we need start 1.33 units to get one successful unit. But we can’t start with 1.33 units; we need to start with 2, and therefore need twice as many machines, labor, and materials to meet the one unit in the same amount of time. 

What?  Time is constant, remember.  And you need to produce one unit.

In production volume (quantities), it’s not as drastic.  If we were producing 100 units, we could start with 133. That’s still not great, but it’s fewer than 200! But understanding yield – preferably, before volume production begins – is a critical way to determine production success.

The Process Behind the Process

Part 2: Using your Multivariable Process Map to Drive Next Steps (Post 9)

The previous several blog entries have delved into the nitty gritty of the Multivariable Process Map; by now you are fully aware that we consider this a key tool in building and refining the manufacturing process of a new product. We wrapped up the last entry detailing the workshop-style meetings that serve to establish and flesh out each step in the Process Map, describing the meetings in sets of “Part 1” and “Part 2.” This entry will go through the Part 2 meetings: validating the content that was created in the Part 1 meeting, closing outstanding actions, and launching into the next block of processes. I prefer using the Whiteboard approach for Part 1’s, as it’s more organic and engaging with the stakeholders.  Some folks prefer building the process maps in Excel during workshops.  It’s really a matter of style, and the flow is basically the same after the capture.

Metrology: measuring quality throughout the manufacturing process

Before we attack Part 2, let’s chat about Metrology and Test & Measurement.  Most products need to meet a set of requirements that the customer desires or are described in a product’s specification.  In most manufacturing operations, a product’s quality is not “inspected” at the end of the production line. Rather, the quality of the product is confirmed and measured throughout the manufacturing process: it is progressively created through inherent process capability, a process’ natural ability to create conforming product or components, and in-process inspections and measurements of CTF  Parameters because they control performance outcomes.

If each transformation or move has Inputs, Process Steps, and Outputs, Metrology is the means of measuring the quantitative “How Good?”.

 We’ll discuss in a future entry the balance of process capability, contrasted to design rule paradigms’ ability to realize design intent.  My experience is that emerging technologies are highly reliant on metrology until experience is gained through production.

The Part 1 and Part 2 meetings

The Part 1 meeting establishes and fleshes out a designated block of operations or process steps. You’ll figure out how many can be handled in a meeting. The Part 2 reviews those same steps – the next set of steps will be in a subsequent set of meetings – and fills out any blanks. Individuals who had action items to review or dig up data can share, and any conflicts or questions from the Part 1 meeting can be resolved.

Part 2 – Review, Actions, Reconciliation, and filling in missing blanks if possible

  1. Show the team the shared directory and where to put content.  Encourage electronic versions.

  2. Plan for the first 20 minutes to be consumed reviewing the actions and activities to tighten up Part 1’s results.  This can be completed in Excel, and stakeholders should have their information ready.  This may or may not happen in the first couple of rounds, until they figure out you’re not going away and will bother them mercilessly.

  3. Get agreement that these designated blocks are as complete and filled out as much as possible and launch or schedule Part 1 on the next designated blocks.

  4. Use the balance of the meeting to capture the content and repeat the workflow.

Identifying and including sub-processes and ancillary activities

As you work through your first process map, you may discover ancillary or supporting activities that are completed with little notice, out of habit, and as regularly scheduled activities. These activities are important and can be handled in multiple ways; the key is that you have identified and thought through how they will be handled in your model (and in your manufacturing process!).  You might also get bogged down realizing that process activities are being carried out offline in preparation for the main process, and or delivered, as a whole, to the process from an internal or external subcontractor.

Sub-Processes:  What do you do with ancillary or supporting activities identified during the mapping sessions?  These would be, for example, regular calibration and maintenance of shared or existing equipment, certain grades of gases and common chemicals that are standard and might impact performance, and chemical expiration date management and control.  Ancillary and supporting activities might not be their own process map but can be captured in the "Touch" Work, Settings, Specs section as something critical.  For example, if a regular calibration improves performance, state: “Calibration verification required before use”.  If there are four “identical” systems, but System 1 is always used, state: “Use System 1 only”.    If shared chemicals are bought to control the process, make sure you control the expiration dates and purity, minimally in the Consumables, state: “IPA, 99.999%, closed glass container”.

Subassemblies, Preparations and Kitting:  All of these activities can be phantoms until a process mapping session is underway.  Often when you take a step back, you realize they are their own process maps.  And why not?!?  You, as the curator, advocate, and champion of the process map, have to decide if a subassembly, preparation process, or kitting is best served within the body of the main process map, or spun out as its own thing. Examples of activities that may be discovered in the process may include:

Subassembly:  An automobile’s motor, transmission, and dashboard are examples of subassemblies.  Economically it makes sense to assemble these components to a point and add them to the final product in this state.

Preparations:  In chemical processing, often a final formulation will be made up from many simpler formulations that MUST BE ready and available during processing.  These preparations are often highly controlled, created and presented to the process in specific states and conditions.

Kitting:  Kitting are activities associate making sure certain components, subassembly, and preparation are “picked” and presented to the process to increase efficiency (not to have to waste time running around looking for stuff) and to increase accuracy (making the right stuff in the correct quantity or amount).  Sometimes kitting is required because of time or perishability considerations.  For example, if Formula 1 requires Part A at 50°C and Part B at 40°C and aged for exactly 1 hour while stirred, kitting these materials to supply them in the correct state is required.  In single piece flow or “Just in Time” manufacturing, kitting is an artform and a highly refined process, enabling rapid product of highly complex systems.

The Bigger Picture: The Multivariable Process Map in context

We’ve spent quite a bit of time at ground level, describing the progression and advancement of your Process Maps as they quantify and detail the manufacturing process. Let’s take in the view a couple thousand feet higher in perspective. Where does this model fit in to the bigger picture? How do we use this information to drive and validate the next steps in our development and commercialization of the product we have in mind?

We see emerging technology commercialization as a four stage business process, with Multivariable Process Maps as stage 1.

Commercialization Stages

This might seem a bit overwhelming. Yes, it’s a lot of work.  (And this is boiled down for startups.)  You eventually want to ship something your customers want to buy, and you want to be a desirable company for acquisition or to go public through an IPO… there’s not an alternative to putting the work in up front (and also throughout each step).  Hard-Tech is HARD.  It’s not software, where bugs are fixed with the next release.   Hardware startups have higher risk, high investment in equipment, and in general, a higher likelihood of missing the target customer’s needs. 

Stage 1 is the foundation, the work and all the parametric content that rolls up into your product.   The process mapping journey you’ve undertaken is the first stage, and the fundamental study and knowledge acquisition of your How that will achieve your What.  I think I’m going to pause at Stage 1, because to complete a company’s first process map is often an intensive experience.  The process map will create questions, and will often work to shore up beliefs and bring light to uncertainty.   I’m going to discuss and explore some underlying thoughts and methods, often used by larger, more established companies during Stage 2, Gap Analysis.   These methods will help clarify background and desired outcomes for Stage 2, by adding tools to your toolkit for contrasting risk and capabilities to product realization.

But before we get into Stage 2, we’ll pause for a few entries dedicated to the Time To Profit thread of our blog. (There’s a lot to think about simultaneously! Your tech guys have a lot of Process Mapping to do; it’s time for the leadership team to be thinking about profitability again.) 

The Process Behind the Process

Part 1: The creation and evolution of your Multivariable Process Map (Post 8)

The previous two blog entries were very much describing the “What” associated with Multivariable Process Mapping (MVPM).  We discussed content in terms of the headings and the type of content captured, and the best profile of a person to manage the content to help the team flourish with the model’s output and outcomes.  This discussion will be about the “How”: How does all this work play out?  How does your team capture the information, and ensure it is accurate? How does the Process Map tool drive subsequent process design?

The basic information collected during a Multivariable Process Mapping effort

This is the basic idea:

Create MVPM by identifying major process steps. Process steps are the natural break points in creating something. Most (but not all) of these major process steps often include:

  • set-up,

  • preparation,

  • execution,

  • waiting for something to happen, and

  • measuring the result.

 A process step with an input, state change, and an output is described as a “transformation.” Sometimes there is no state change as part of the process step, so that step would not be a transformation, but rather, a “move.” In some processes, moves are a big part of the overall production time (sometimes called Cycle Time) and have very specific requirements.

The diagram below represents the basic concept of the process mapping and the elements that will be captured, and later created to control your process. In this diagram, each operation or step of the build process is represented in blocks on the left, as an operation number and transformation or move designation. Each step or operation will have inputs, process steps, and outputs. Quality testing or measurement may occur several times during the operation for any Critical to Function (CTF) parameters: testing and/or measuring inputs going into the operation, potentially several times during the process steps as needed, and testing and/or measuring the output of the operation. The next blog entry will detail the CTF and testing influences more fully.

The Basic Transformation Relationship Diagram where CTF is abbreviation for Critical to Function Parameters

How are Multivariable Process Maps Useful

  • They capture basic information about product: how it’s built in the originator’s imagination to repeat how they got to the result

  • The method uses the originators’ brains’ “process flow” as a guide, to describe how a design was built and what exactly went into the effort

  • In these early stages, these process maps become the Fundamental Backbone for storing information until it can be formalized and controlled (more on this later)

  • Process mapping of any type is typically associated with manufacturing, and not early commercial efforts, until now

  • They become the engine for more advanced modeling methods and product data management

  • MVPMs help avoid rehashing less productive, previously eliminated outcomes by memorializing inputs, transformation, and outputs that work, or don’t work…

Relating to what I said before, if you don’t have an element shown in this diagram, don’t let it stop you.  Note it and move forward.  Later Readiness Activities will help prioritize this work (more on that later).

Creating and updating Process Maps using Workshops

Here are some suggestions associated with driving the methods of harvesting process map information. Although an individual team member will be designated Process Map Lead and will own initial data gathering (and drive the ongoing evolution), holding group meetings or “workshops” are key, to ensure all perspectives are considered and all team members are committed to the process.   

  • The executive leadership must prioritize and support these workshops and socialize and drive the employees’ perception that is critical to the success of the company.

  • The Process Map Lead should manage the scheduling and notifications, so people can prepare and be mindfully present.

    • Send out emails explaining that there will be Process Mapping Workshop and give stakeholders a rough schedule of when, and of whom will be needed. 

    • Schedule a kick-off meeting with all stakeholders, explain the methods in term of high-level overview, basic methods, and desired outcomes.  And make sure folks understand that this effort has executive visibility and should be seen as a priority.

    • Each workshop meeting should be no more than 2 hours.  People lose interest and will perceive they have to get back to work.   Don’t fight it in the beginning.

    • Schedule individual Process Map Capture Meetings, starting from the beginning of the process, with the responsible stakeholders (product development engineers, process engineers, test engineers, production supervisor, support technicians, team leaders, and senior production operators)

      • For example, if there are different team members who are responsible for different process steps, don’t burden others with having to sit through a session not related to their work.

      • If indirect stakeholders are downstream “internal customers” interested in the “how”, invite them.  If an upstream internal supplier disproportionately determines process capability in the process you’re capturing, invite them.

      • These interdependencies and reinforcement of internal customer-supplier relationships will be critical now and later.

    • Hold the meeting.  I’ll discuss this in the next section.

    • Send simple meeting minutes to all stakeholders, explaining what was captured, and what will be achieved in the next meeting.  Also, this is the time to formalize action items and commitment for missing data, that someone has to chase down.  Be direct and DO NOT apologize:  What is owed, by when, by whom.

Facilitating the Process Map Capture Meetings

Congratulations, you’ve tipped the scales of influence and employees are excited about – or at least engaged in – moving forward.  The introductory meeting has been held, and executive management has aligned and confronted dissenters who claim they have better things to be doing than ensuring the success of the company by sharing and not hoarding their knowledge.

The first challenges you may encounter, before your first workshop, are: data hoarding, tribalism, paranoia, and hubris (surely, you’re not bright enough to understand my important work…).  The process map capture leader and facilitator must listen and ask questions, perhaps from multiple directions and perspectives.  They must use their influence and other’s influence to drive for answers and get the details that allow a process to be executed, repeatably.   Often people have a lot of fear when they are required to give specific and quantitative answers for parameters and states they usually just wing it and hand wave.  This fear is particularly acute if they are failing to repeat earlier results, and they truly believe they are the only one who can return to the previous state of grace.

Each Process Capture meeting should be handled as two meetings, Part 1 and Part 2

Part 1 – Designated Block of Processes (you’ll figure out how many can be handled)

  1. For part 1, use a whiteboard and write down the process steps that will be covered in the meeting, as a horizontal list, leaving space between each.  The columns can be created beforehand.

  2. You can start numbering or save it for later.  I recommend saving it for Part 2.

  3. Agree to the name of each step and get consensus that everyone understands the boundary for each step.   Simply put, make sure that there aren’t hidden processes, before, after, or within a step that should be stated and broken out.  Sometimes, these hidden processes pop out during the capture, and everyone agrees that it’s its own thing.

  4. Once everyone agrees to the process steps, and that it’s sufficient in scope, start filling in information.  DO NOT FREAK OUT IF THERE ARE EMPTY BLANKS!

    • Type:  This sometimes takes time to determine these supersets.

    • Times:  Early on these will be estimates, maybe from lab notebooks.  Sometimes they are guesses.   Future action will be to quantify and firm these up.

    • Yield:  This could be a fiery discussion because poor yields hurt people’s feeling.  From my perspective, they are what they are.  They are a function of the design capability, process capability, test capability, and technical understanding of the process.   The concept is referred to as Design Intent.  Yields are something to be improved over time, with increased knowledge and refinement.

  • Material Cost:  Like times, early on these will be estimates, maybe from lab notebooks.  Sometimes they are guesses.   Future action will be to quantify and firm these up.

  • Equipment:  Should be straightforward, as these are expensive and often big.

  • "Touch" Work, Settings, Specs:  This will be the most detailed and data intensive sections, because this is often the “How” and “How Much”.

    • Touch Work:  Have the stakeholders explain the basic activities associated with this process step.

    • Settings:  If equipment or systems are set to “set points” (e.g., temperature, pressure, duration). 

    • Specs (Specifications):  If you know there are process for performance limits (e.g.:  resistance (Ohms) after soldering, power or loss (mW or dB) after coupling a fiber optic device, surface finish or roughness (um) after etching),    specifications are the best guesses you have of your processes limits to achieve a desired outcome at the next step.

When 2 hours is reached, summarize the last process step, thank everyone, inform them of the next meeting, immediately take a picture of the whiteboard, and collect all notes and content.

I suggest at this point setting up a shared file directory with three subdirectories.  Why do I care about storage and naming conventions.  Because it’s in line with the basic philosophy that it’s more expensive to search or repeat than to leave a sufficient trail of breadcrumb to retrieve information.

  • Process Maps

    • Populate your process map in the Excel file template found at the follow [link] with the contents for Part 1.

    • Each version should be named and dated [Best Product Process Map (09-21-2022)]

    • Note that these files will grow with each Part 1-Part 2 session

  • Supporting Contents

    • These are documents or scans of notebooks to support the process map

    •  Name something like this [Mixture B formulation from Bob’s notebook]

  • Whiteboard Pics

    • Use your smart phone and a number of apps (OneDrive, DropBox) which have whiteboard to PDF converters built in.  Take pictures of the workshop’s content and save them a PDFs.

    • These are the archives of the process map sessions Part 1

      • Name the file something like this [Whiteboard, Ops 1 thru 6, Part 1]

    • Also, in my experience, people will jump to the board to clarify points and processes.  THIS IS GOLD.  Take a picture and save them.

      • Name the file something like this [Part 1, Mixture B sketch by Bob]

The next blog entry will cover Part 2 meetings and how to validate Part 1’s content, close actions, and launch into the next block of processes.   At this point, you have a philosophical and user choice.  I prefer using the Whiteboard approach, as it’s more organic and engaging with the stakeholders.  Some folks prefer building the maps in Excel during workshops.  Think about it.

Example of a MVPM Template

A Deep Dive on Process Modeling

Building and maintaining your multivariable process map: where to start, how to develop, and who should own this critical tool for managing your product development process and understanding risk. (Post 7)

In the previous post, I rolled out some thoughts on the value of multivariable process mapping, even very early in product and process development.  I showed you the basic construct and then left you hanging.  Apologies, but the last chapter was getting too long to include the details, and it wasn’t adding anything to what I was trying to convince you of, which is that your limited and precious resources are best spent creating these colorful, but somewhat dry and detailed spreadsheets.

Continuing the commercialization discussion of the “How” with multivariable process maps

 This installment will go through the specifics of the process map in detail. This document is (as I argued) a key model to the success of your product – a repository for initial information, and, as it evolves, the key source of ongoing process design as you move through the Product Life Cycle. Further, given the crucial nature of the accuracy of the data in the process map, another key decision will be: who puts this together (and keeps it up to date)? We will discuss the ideal member of your team to author the multivariable process map and own the upkeep of its contents.

Building the initial Multivariable Process Map

In the previous post, I emphasized building an initial process map very early on, as the product is still a rough vision. Create a simple spreadsheet, with rows for each step in the build or implementation process. These will start as broad steps, continually expanded into more granular steps as the details of your design are fleshed out. Many items will be blank early on. But these blank spaces will provide some sense of where there are unknowns in the build process, where there is still design work to do, and where more risks may lurk.

The columns or headers in the spreadsheet fall into these major categories, explored in much more detail below.

Index – the description of this step, with references to other documents if applicable.

Process Details – the details of this step, including duration, yield, and costs (as summarized from other columns).

Touch Work – Description and duration of hands-on labor required for this step.

Capital, Expensed Items, Consumables – Materials and tools associated with this step, key for cost summarization.

The nitty gritty

And now for some less exhilarating – yet still, hopefully, inspiring - discussions on the specifics of the process map headings: what do they mean and why do we capture them, even early in a product’s development?  At this point, Service Based startups might not benefit as much, but some of the concepts in this chapter might be useful, if you’re conceiving of a “call center”, customer support operation, or other service model endeavor.  Even customer service and order taking models align well.

Index

Op. Numbers (Operation Numbers):  These are simply numbers, usually by 10’s (010, 020, 030, that allow numbering a tracking of process steps and transformations.  Why 10’s?  You have 9 places to add steps you missed.

Type:  This is a basic descriptor of families of operations aligned with the specific process and manufacturing type.  For example, if it is a chemical formulation process, then they might be: Weigh, Material Add, Mixing, Polymerization, Heating, Cooling, Tempering.  For semiconductor process:  Plasma Etch, Metal Plating, Load Wafer, Metal Deposition, Unload Carrier, Wafer Heat.  For a micro electrical assembly:  Die/Component Pick and Place (P&P), solder dispense, adhesive dispense, solder, wire bond.  These should be large buckets, of which process descriptions fall into.  For example, there are many types of plasma etch types and systems.  Plating dependent metal types and desired thickness and uniformity.  Chemical formulations can use weight or volume for material add.

SOP Doc. Number (Standard Operating Procedure Document Number):  These documents are also called process sheets, assembly guides, run sheets, and work instructions.  In the beginning of a product’s development, these might be notebook or process journal entries.  The intent is to leave these as a placeholder for future formalization of these steps.  If you don’t have them, leave it blank.

Process Description:  Using the “Type” reference above, this would specific variety of process type.  For Example:  O2 plasma etch (of Plasm Etch); cooled fixed RPM mixing (of Mixing), Forced Air Cooling (of Cooling); Gold Sputter (Metal Deposition); VISCEL P&P (Component Pick and Place).  Make these specific enough to give the community an idea of intent of the process.

Transformation:  This is a more difficult concept, representing the move from one state to another. Most steps in the process likely do not involve a state transformation, but if they do, it is important to note it here.  It might be an epoxy exothermically curing because the user applied a mixture of Part A and Part B, and letting it cure to secure a component or seal joint; the transformation would be cure.   It could be going from an untested state to a tested and calibrated state; the transformation would be functional test.  Sometimes, particularly in material and chemical compounding, there are interim states, requiring certain timing and waiting to achieve desirable outcomes.   These are often controlled cooling or tempering that allow chemical reactions or energy states to be maintained and stopped.  The often have names based in the company’s nomenclature, like colloidal dispersion, filler agglomeration, or catalyst settling.  The basic rule is that a transformation is identified if it’s critical to the performance of the process and process capability.

Process Details

Man-Minutes per unit:  This is the time it takes to complete the process from the beginning to end.  If it’s loading an oven, it might be 2 minutes.  If it’s compounding a chemical solution or a complex assembly step, it might be 20 minutes.  If it’s greater than 30 minutes, you might have the granularity you need, in that too many process steps are being bundled.  These are often call time standards.

Machine Minutes per unit:  The big difference between Man-Minutes per unit and Machine Minutes per unit, is that sometime a machine is manned and sometimes it’s not.   The classic example is a batch oven, where an operator or technician takes 6 minutes to load and unload trays into an oven, and the bake cycle is 60 minutes.  The applied labor (Touch Work) is 5 minutes , and the processes cycle time is 60 minutes (machine time).  Of the 60 minutes, 10% is touch work.

Process Yield:  In process intensive, transformation intensive processes, yield is a big deal.  What is yield?  The percentage of good units divided by the started units.  If you start 100 units and get 95 good units, your yield is 95%.  Conversely, your defect percentage is equal to 1 - Yield or 5%.   Most people involved in processing have an idea of what this ratio is.  There will probably be an entire blog chapter on Yields, how they can impact cost and capacity, and why they are one of the Key Performance Indicators (KPI) in certain industries. 

Material Cost:  This variable is simply the total cost of all materials used or consumed in this process step.  This is less critical during the early stage of process map development and becomes more important as the product and process mature.  Understand that sometimes, materials are so rare and/or expensive, everyone understands them early in development.  If available, we will capture. 

Capital Equipment Cost:   If a process step requires dedicated, expensive, sometimes borrowed, or shared resources, understanding this sooner than later is important.  For example, start-ups that use wafer foundries are often shocked by the sticker price of the equipment they counted on when they have outgrown the foundry’s operating rules.  Otherwise, even if they are estimates, it is worthwhile to start populating this cost field as soon as possible.  You’ll be surprised how quickly such costs add up.  This is the total cost of the Capital (Equip1, Equip2, Equip3) fields’ equipment.

Capital (Equip1, Equip2, Equip3):  Capital is an accounting term for equipment, usually costing greater than $1000 dollars.  In larger companies, these capital values would be depreciated over time.  One of the model’s basic assumptions is that the plant’s production space is provided for, so you don’t have to list every table, chair, and work light.  These quantities are usually derived later from the number of workstations the model says you will need for a given production model (yes, the model will tell you things…).  In the beginning, assume one station.  Equip1 (Equipment1) represents a machine required to perform the work in the process step.

"Touch" Work, Settings, Specs (Work1, Work2, Work3, Work4, Work5, Work6):

Touch Work is actual, hands-on labor, to complete the process step.  It can also be time associated with set-up; although if set-up is long and complex, that should be broken out.  Same thing with process validation and quality assurance.

Settings are machine states in which a technician or operator sets a piece of equipment to initiate, transform and complete a process step.  The simplest is setting an oven.  Sometimes settings are complex, involving multiple states and domains, temperature increasing over time and pressure.

Spec (Specifications) are, well, specifications.  The formal definition is:  an act of describing or identifying something precisely or of stating a precise requirement.  Spec is nomenclature, an abbreviation and shorthand.  Specifications are the target or limits, measuring the how well the “How” achieved the desired “What”.   They can be Final Specifications facing the customer, or Interim Specifications, that if met, enable the next steps in your process.  They can be after the fact, like Test and Quality Specifications.  They can be actively controlled and executed specifications like Process Specifications.   The notion is that Specifications are a formal vehicle to define important inputs and outputs in your process.

Expensed Items (Exp1, Exp2, Exp3):  Where capital is expensive, expensed items are typically lower cost items, which likely are not customized for your process.  Examples are solder irons, hot plates, and hand tools.  But while these might be generic in nature, their specificity could be critical.  For example, a hot plate might have integrated magnetic stirring or not.  This is a big deal in chemical compounding.

Consumables (Consume1, Consume2, Consume3, Consume4, Consume5):  Consumables are not necessarily low cost.  Consumables include equipment or materials that are consumed during completing the process. For example, these could include swabs or wipes.  They could include chemicals to prepare containers or surfaces.  They could be gases or catalysts.  In all these cases, if it’s a process intensive product, these consumables will have their own specifications for purity and cleanliness.  These are not materials that are actually part of the end product, which is controlled in another tool, called a Bill of Materials (BOM).  I’ll discuss BOMs, Routings, and their importance in another chapter.

 The keeper of the (figurative) keys

At this point, I’d concentrate on reviewing these elements, start to account for what data is available and where, and think about who is best suited in your organization to maintain these process maps and other modeling tools. Consider this individual carefully. 

  • From my experience, the charismatic product development leader is not the best choice; they will lose interest in the details, and without knowing it, devalue the effort in the eyes of the employees.  

  • Another candidate who is often chosen to maintain this would be a hard-core quality professional, who will likely be too rigid, risk adverse and/or cautious to allow the team flourish and grow into the knowledge, because they will be freaking out that every box isn’t filled out with information (which is likely not available) and is in the correctly sized and colored font. 

  • I know these are two ends of the spectrum, and I did this on purpose; maybe my characterizations are a bit extreme and bordering on offensive.  Perhaps so, but in my experience, they are not untrue. 

  • And again, startups can’t afford as many mistakes as larger established companies can absorb.  There is no perfect candidate, but the one that work best might be an introvert (privately) and who is social enough (publicly); someone who has some extrovert tendencies, willing to dig to gather information from sometimes reluctant coworkers; someone who likes to actively listen and ask clarifying questions; and who values quantitative data and using it to make decisions.  A little bit of anal retentiveness does not hurt, and having good documentation management practices helps.

Professional characteristics of a good candidate to manage the process map:

  • Analysts with engineering backgrounds.

  • Process engineers that love system modelling.

  • Production professionals who have managed transformation processes (and have the scars to show it).

Professional characteristics of a not-so-good candidate to manage the process map:

  • The long and suffering intern or coop. They are perishable and don’t have the authority, Influence or power needed to gather accurate information from other members of the team.

  • The person who’s failed at everything they touch but the “culture” can’t do the right thing and fire them. It may be tempting to utilize this person – they probably have time on their hands – but maintaining an accurate process map is too critical to the success of the project.

  • A founder or executive, because people may not tell them the tough truths and they hold too much influence and power.

In the end, this team member must be comfortable with the power and influence they will gain, and management must be comfortable delegating that authority to them, letting the team develop the content and the model.

Understanding Risks in Real Time

Creating and using Multivariable Process Maps as a tool for deep awareness of your startup’s well being
(Post 6)

Understanding the risks: The Knowns and Unknowns

The name of this blog is Full Arc, which is English translation of my company’s name, Arc Completa.  I truly believe those who are endeavoring to create value through a startup enterprise need to understand and not underestimate the risks and the pitfalls, particularly as the risks combine and compound over time and through each phase of the product life cycle. It is necessary to maintain this deep awareness from the very inception of an idea to volume production shipments, that is, for a product’s full arc.

This blog and these methods don’t describe a canned solution for success, as some other business systems may claim.  What it will give you is the best prescription lenses to assess your performance objectively, with a high gain “Spidey Sense” antenna to predict and model risk.

I’ve also learned that I achieve the highest level of awareness when I’m able to admit I don’t know the solution to a particular problem.  It doesn’t mean that I’ve given up; it means that I know that I’m trained and objective enough to determine and eliminate what’s not causing the problem (the Knowns).  This allows me to stay focused on as-yet-undetermined roadblocks (the Unknowns).

In Post 3, I stated: “A hard-tech entrepreneur needs to be comfortable with the knowns and unknowns.  Once something (parameter, process, material recipe) is better understood and is heading toward a Known, control it and make sure it can be realized repeatably and sustainably, and at a sufficient level of control to ensure it does bother you again.  If the parameter keeps sliding back into instability, or has a disproportionate impact on performance, it might be a CTF.  These need special attention.”

But how does one understand and capture the knowns?  Furthermore, how does one start to identify possible candidate CTF (Critical to Function) parameters?  The answer is you create Multivariable Process Maps for major design elements and sub-elements.

Capture the process early in the process

This is where the informed reader may pile on, so hold on (…assuming someone out there is interested enough).  Arc Completa’s theory is that Multivariable Process Maps, established very early in the product development cycle, should capture the realization process that achieved the most stable desired outcome and performance of the product.  This means THERE WILL BE MANY unknowns. And that’s OK.  I acknowledge that there is disagreement about creating a formal Process Map so early in the process, but our experience bears this out. Capturing the knowns will aways emphasize the unknowns, and the variability and uncertainty can be addressed in a structured manner.

This is the basic idea:

Create Process Maps using major process steps

  • Process steps are the natural break point in creating something.

  • These major steps often require set-up, preparation, execution, waiting for something to happen, and then measuring the result.

  • Early process maps always have a lot of hair on them, and need to be curated and refined by a committed leader and a team.

  • But really, where else should you start? This is the process that created what you think has value.

Process Maps

  • These types of Multivariable Process Maps are developed to capture basic information about product: what it is, how it’s built in the originator’s imagination, how they got to the result.

  • The method uses the originator’s brain’s “process flow” as a guide, to describe how a design was built and what exactly went into the effort.

  • In these early stages, these process maps become the Fundamental Backbone for storing information until it can be formalized and controlled (more on this later).

  • Process mapping of any type is typically associated with manufacturing, and if executed, these process maps become the engine for more advanced modeling methods, which you get for free (more on this later).

  • The established Process Workflow, as the reference during product, process and test development, and the product and process are refined, often providing momentum toward achieving your goal, while avoiding rehashing less productive, previously eliminated outcomes.

  • As you achieve success and pass phase stage gates in a Product Life Cycle, Process Maps become accounting and storage tools to safeguard information until it can be transferred to an appropriate document, specification, ERP (Enterprise Resource Planning) System and or PDM (Product Data Management) System.

  • Critical to Function (CTF) Parameters and Interdependencies start popping up.  Because these are the pain points everyone talks about in the lab, the ones people stay up late thinking about, they are already consuming resources from different directions, and might be the factors people are fearful to mention, because it will chill everyone’s startup revery excitement?.

  • Once established, your set of Process Maps become a reference that is regularly updated to reflect most current assumptions from product, test, and process development.

  • And lastly, if the product development, operations, and supply chain teams do their jobs, all the content will migrate to appropriate tools and applications, rendering the process maps obsolete until the next generation (more on that later).

A Sample Process Map

So, what does a Process Map look like? It’s a spreadsheet. Yup, a good old Microsoft Excel spreadsheet. Why Excel? Because I’ve found it to be ubiquitously available, understood in technical communities, and powerful.

What’s in the spreadsheets?

The basic data types collected in a Multivariable Process Map

In the next chapter I’m going to share the definitions and examples for each section.  Future posts will cover the methods and processes associated with running a workshop to harvest the information without getting discouraged.  Also, we’ll cover some ideas on how to use and prioritize what you’ve learned.

This is where I’m going to have to ask you to trust me.  I’ve been wrong and have made mistakes in my technical and commercial endeavors.  I try my best to own them and get ahead of them, constantly finding new tools and methods to help my clients.  But in my career as a technical and operations leader, variations of these basic process maps were the secret to my success.  They allowed me to see potential when others lost hope.  They allowed me to master complex technologies and systems and communicate highly technical topics is terms of dollars and risk to boards and investors.  They allow companies I’ve managed to grow quickly and increase profitability, faster than competitors.  They allow me to solve problems faster because I always know the baseline performance.  But mostly, they memorialize critical information that all stakeholders at startups need access to in order to succeed and become profitable.  I’ve used them at greenfield startups and Fortune 500 companies.  The basic concepts were taught to me by one of my most gifted mentors 35 years ago and I’ve been improving them since. 

These process maps will be your guide and framework to decide where resources will be applied, what is working and what is not, and what costs too much or uses too many resources.  But mostly, they function as an objective scorecard for your success.  These are the foundation for multivariable modelling methods.  Inherent in modelling is capturing the present state, and then testing scenarios for the future desired outcomes.  Having an accurate awareness of the present and a solid foundation to model the future is the power, and the visibility that will set you apart as a startup enterprise from other startups.  You will use quantitative models that inform decision making and communications, backed up by the most current and up to date data, experiences, and outcomes, to drive your company to the shortest Time to Profit.  And that is just the beginning.

Exploring the Product Life Cycle

Managing the life cycle of a product requires understanding your problem space, careful attention to the business environment, and deliberate decision making
(Post 5)

A great idea is the foundation for many startups. But building a successful enterprise requires investors, and investors like to make a return on their investment. The next few blog chapters will be dedicated to some basic concepts that are critical to further discussions on commercialization. This installment will focus on the Product Life Cycle.

Typically, at this point in working with a client’s development community, I’d immediately plow into a discussion about product life cycles and the various types of roadmaps that need to be managed by a startup enterprise. In rethinking how I present and build understanding around these concepts, I’m going to shift to a discussion around design and process techniques.

Why? Because at some point a startup needs to capture the best estimate of the “how”- that is, how the idea is going to be brought into the world, through analysis, implementation, and productization. And I believe that’s strongly associated with core technology development, sometimes in the lab. Very likely design and performance decisions are being made, because technical people love the “how”, and it’s in the best interest to understand this work.

As a side note, I may return to methods of developing an understanding of the “What”.  While I’ve developed techniques, and implemented them successfully, there are so many people better at teaching these methods.  Perhaps I can get one of the experts to write that chapter.

By industry and service offerings, Product Life Cycles can differ from each other significantly, regarding the requirements associated with moving from one Phase Gate to the next.  Basically, a Phase Gate is a decision point, where the project team, program management, management and/or executive management decide, quantitatively, that a product or service meets all the requirements and resources can be spent on achieving the next phase. 

Generic phases could be summarized as:

Phase I: Refinement of the idea. Initial implementation, initial cost analysis, market exploration.

Phase II: Launch Production. Production implementation including raw material acquisition, tooling/machinery for scale, pricing, and marketing activities for target marketplace acceptance. This is typically a high investment, low return phase.

Phase III: Mature Production. Systems and material sources are in place, product is known in market. Highest efficiency and profitability phase.

Phase IV: Product retirement. New technologies or market forces have overtaken the viability of the product. A controlled exit from the market is imperative before stockpiles and falling prices erase prior profits.

An important concept is one of Intrinsic Cost.  Intrinsic Cost is the cost represents the elemental cost of an assembly at higher volume levels of production, minus the Bill of Material (BOM) cost.  Basically it represented the labor, supply chain overhead, depreciation, and other costs that are regularly absorbed in realizing production.  There are other elements of intrinsic cost in the supply chain, but these are quickly absorbed in earlier PLC phases.  The concept of Intrinsic Cost attempts to represent the cost of realizing production of a product, instead of the designed-in components that are required to make the device performance as advertised. Often the actual cost to produce the product is well above the intrinsic cost until late in Phase II.

Below is a simplified Hard-Tech product life cycle for a typical integrated semiconductor or sensor product.

Simplified Product Life Cycle (PLC): 

Phase I:  Pilot, Pre-production, and Qualification – A high cost, low volume effort to establish design intent, process and design capability (Yields and CpK), and qualification against customer requirements, before the decision must be made to fund increased investment to realize higher production volume potential.  Time to market is the goal of the phase.  The expense and capital consumed during this phase are basically sunk costs and may or may not reflect or represent the final intrinsic product cost. 

Phase II:  Ramping Production – High investment phase, where capacity is being brought on-line and qualified to the original performance baselines from Phase I.  Time to Profit is the goal of this phase.   Economies of scale and process refinements start to drive the cost structure towards the final intrinsic cost.  The designed in yield, labor, and cost targets start to be realized more often than not, and efforts continue to close and eliminate major startup yield issues.

Phase III:  Steady State Volume Production – Demand is being fulfilled, with high efficiency and utilization.  At this point intrinsic cost should be at its minimum.  At the beginning, the net profit margin is highest, and by the end erosion has started.  Sustainable and predictable production and fulfillment is the goal of this phase.  Yields and product costs are basically representative of what the actual designed-in cost and yields are, regardless of models.  The ability to affect change is limited because of the associated risks to customers unless externalities require acute action.

Phase IV:  End of Life (EOL) Production – Because of newer, lower cost, higher performing offerings (or competing technologies), planning is focused on last orders, and minimizing purchases to close out existing commitments.  Margins have eroded to the point of loss, and the goal is to kill the product before a costly quality issue arises because of decreasing emphasis and resources.

Example of Product Life Cycle Normalized Cost and Profit Model

As a company develops a product, the cost of producing a product will go down, while the profit will go up.  That is until the end of life, when demand may diminish because of competition, and selling price is reduced.

We will cover variations of this diagram in later blog chapter, but this set of theoretical curves is illustrative and worth deeper examination. In Phase I, costs (blue) are high, and profits (green) are zero. As the product moves from idea/prototype into market-ready, larger scale production goods, costs drop and profit margins rise, seeing crossover into overall profitability sometime in late Phase II or early Phase III. In Phase IV when market forces have brought about the end-of-life of the product, demand goes down, costs level off (and may even rise as scale is reduced), and profit margins begin to drop, sometimes precipitously.

In the diagram above, Phase IV product retirement is executed before profit margins have been reduced to early Phase II levels, but we can see where the curves are heading: if the exit ramp to product retirement and production halt is missed, costs go way up, profit margins go way down, and the lovely Phase III pile of cash is no longer. It’s easy to coast when you’re on top of the world, but in reality, Phase IV is inevitable and staying attuned to the marketplace, being aware of up-and-coming technologies, and a good dose of humility are the tools needed to achieve graceful and profit margin sparing product retirement.

Remember to solve a real-world problem

The cost/profit margin model above only hold true if the maturation of the product (or service) development process needs to be directed or aimed toward a solution that solves a problem (see Blog Post 4).  The best salespeople are great because they can relate to the pain their customers are experiencing and provide solutions.  The problem is, making sure they have an offering that the customer values as a solution – something that solves a problem they are actually experiencing.

The universe is a big place with infinite options.  When a company is shrewd or sometimes lucky, they create value by providing solutions to problems that consumers are willing to pay money for.  

The point of this blog is to focus a startup on Time to Profit.  But it’s also to allow the startup to master all aspects of running a Hard-Tech start-up.  While the graphical representation of a PLC is often presented as some sort of law of nature, to achieve predictable commercial outcomes, a startup needs to think beyond solving the immediate problems.  The hard-tech startup needs to keep in mind that each Phase will have different constraints, enabling or disabling factors, production volume and performance expectations, and profitability requirements.

In the next chapters we will introduce and demonstrate tools that, when created, will build the foundation for modelling and understanding how your product meet all PLC Phase requirements and accurately predict profitability, while building a knowledge base of critical factors enabling controlled product development and growth.

Communicating dollars and risk

You might ask why I keep emphasizing Time to Profit.  Simple, investors think about startups in turn of Return on Investment (ROI) or in simpler terms, dollars they invested versus how much they’ll make.  A startup CEO and senior management must get used to describing your company’s performance in terms of dollars and risk.  The sooner, the better.  It is your job to convert performance and metrics, regardless of the type, to dollars, so non-technical people can relate them to risk.   Better yet, contrasting your business and operational models to actual performance, while explaining gaps and recovery plans, will build confidence with investors (likely now Board Members).  In my experience, this will keep a Board of Directors from feeling the need to micromanage you.  Use the phases of the product life cycle, and the associated expectations about costs and profit margins, to set expectations. We’ll discuss this more in future chapters.

A later blog post will explore the significance of managing these PLC by understanding design decision thorough the concepts of platform design.

Defining Product Requirements

Developing a product that solves your customers’ problems
(Post 4)

Your customer has needs. You have a brilliant product. But is it a solution to their problem? We investigate how to develop the perspective needed to create a product offering that your target market will immediately recognize as critical to their business. 

It’s key to recognize the distinction between how the target customer thinks about purchases, versus how a product provider thinks about their offerings. Consider the diagram below. The target market bubbles on the left reflect the customer’s point of view: they are thinking about the problems and challenges they face, how to break into new markets, how to improve their business. In contrast, a product provider’s considerations about their offerings are shown on the right: the implementation details of their product, including costs, risks, future enhancements, etc. These bubbles are not the same! And to achieve a solution (and a sale), the seller needs to bridge the gap, making sure the product they are creating and offering to the marketplace is meeting a need in that market.

You’ll notice the target market’s needs are not just your typical “Eureka!” products typically envisioned when we think about a new company. The product offerings could be derivations of existing product offerings, improvements, enablers applied to new markets, behaviors to be changed, and new performance and cost reduction paradigms. The product and services can be quite subtle, from enhancement to an entirely new platforms (more on platforms later). They could be new disruptive technology, or an existing technology applied in a new way to create value. Regardless of the nature of the product or service offering, I break the world down to the “What” and the “How” as shown in the next diagram, or “What” I need and “How” I’m going to get it.

I first started thinking about the “What” and the “How” when I was consulting and working with teams to solve very difficult product and process development problems.  The problem with the material science-based companies I often work with is that the process enables the product, and not the other way around.   They are so tightly linked, there would be no product innovation without constant refinement and improvement of the process and equipment.   The Product is the Process, and the Process is the Product.  This is where I first encountered the confounding nature of the “What” and “How”. 

Engineers, physicists, highly skilled technologists, and other highly technical people always jump ahead to the “How” without fully understanding what the actual problem is and who is the receiver of the problem solving “services.”  Why?  Because problem solving is fun and is what technical people live for.  Their entire professional development has been based on solving problems that are out there, not taking the time to understand the problem that real live customer needs to solve, how to measure the results to make sure the problem is solved, and ensuring the solution is durable and sustainable.  For larger companies, this can be a wasteful practice, but won’t likely put them out of business.  For a startup, at all levels, it can be a disaster, wasting valuable time and resources.

Later, there will be chapters on the nature of technical decision making contrasted to risk.  For now, I want to focus on the value of a startup taking time to understand the “What and How” of their product or service.

Understanding the “What”

Finding the target customer, understanding their market, know the competitors, doing research, and asking the right questions fuel the search for defining the “What”:

Understanding the “How”

Keeping the “What” in mind throughout the development process ensures you will not be searching for a question for your answer later in the game. The “How” questions are very different, but are informed by the “What” of your target market.

Any one of these arrows could be a chapter, or more likely a college course.  But the startup needs to be aware of these factors and constraints that can shape requirements in their decision making.  Some of these topics will be woven into this blog, whereas other are placeholders for future independent research.

And now the “Why”

We want to ensure the highest probability of delivering a product or service with features that customers actually want.  Companies with De-Risk Design and Product/Service Development efforts are more likely to achieve profitability by eliminating money wasting behaviors and have the highest ROI (Return on Investment).  These requirement defining methods help validate the product’s or service’s value through the lens of the people who BUY them, when they have a problem to solve, whether it’s real or perceived.   Lastly these methods Conserve Resources (less spending) by ensuring focused product (service) development based on quantitative analysis and NOT Gut Feel, which saves money in commercialization because there will be less changes in design and manufacturing.

The “What” and “How” defines your Product Life Cycle (PLC) Phase I which will be discussed in the next chapter. And it’s the phase that gets a lot of attention from investors and prospective customers.  The work of thinking about the “What and How” is free, as well as the concepts I’ll be sharing in the next chapter.

If you’re interested in getting templates of Marketing and Product Requirement documents, click on the this link PRD and MRD Content.

Time to Profit is the Purpose of a Startup

Identifying the keys to Business Growth
(Post 3)

In the first blog chapter I mentioned a new idea of Time to Profit.  Often people in the startup ecosystem talk about Time to Market as a significant measure of success. 

What’s the difference? Time to Market proves you can ship a product, placing priority on getting something “out there” and hoping it meets all the market’s requirements for performance, reliability, and production scalability. Sometimes, a startup considers the strategic aspects of presenting a product to market. But often, they don’t consider all of these factors, and the initial product offering falls short. This may cause early adopters to abandon the first product offering, hoping for a second product that never comes. Then social media takes over and the shortcomings are the headline news, negatively influencing the next generation of potential customers. The company winds down while looking for additional rounds of funding, reducing headcount, until the doors are locked.

Time to Profit is a different approach where certain performance, growth, and interdependencies are considered up front, allowing a startup to offer a “Known” first generation, with the foundations of a second generation being laid, as the first one ships. It borrows concepts from larger companies, for example platform design, and design for manufacturing and testing, but does NOT let them slow the commercialization progress, managing the risk required to ship the first ever product of its type. These concepts allow the startup to know very quickly what can be counted on, and what needs extra attention. Stated in another way, it allows the startup to rank and partition risk, whether it’s design, reliability, supply chain, process or test and then manage it objectively.

This behavior allows the internal alignment of resources on solving problems that need to be solved, and better communication of those risks internally and to investors. This helps to reduce the stress associated with potentially difficult times by knowing the “Knowns”, so resources can be applied to solve the “Unknowns”.

My goal is to provide technology-based start-up (and growth) companies with the best product commercialization methods and techniques to enable companies to achieve the fastest possible Time to Profit.

The Big Question: Can your startup settle down enough to see what’s going to STOP you from commercializing your first product? Startups are all about the positive, emphasizing culture, hard work and fun. But as inconveniently and previously mentioned, they are also expected to become a profit-making enterprise.

Getting rid of the noise

You’ve started a new venture, and shared this exciting news with friends, family, and business contacts. These interested parties – not to mention, investors and other stakeholders - want to hear what’s going well. Very often, there is little in the way of discussions on what needs be done, by whom, by when, to reach the next performance milestone. Startups love to discuss things in terms of “Good and Bad” but fail to discuss things in terms of “How Good and How Bad”. The subtle difference makes a huge difference in answering the above questions.

Good and Bad is qualitative, How Good and How Bad are quantitative. Hard-Tech startups often require the compilation and analysis of many process steps, at many process states, with many precision materials added in a precise order. These factors often combine, in a multifactored ways, to create the desirable results that enable the new product offering. Even when it’s a hybrid system of hard-tech components, controls and signal processing, these design elements need to be understood from a design margin and compatibility perspective.

I figure at this point I can introduce this concept that Signal to Noise Detection at all Levels is the Challenge! Signal vs noise is a shorthand that engineering types use to differentiate the information that is needed or meaningful (the “signal”) versus the random variation or static that interferes with the signal (the “noise”). Think of your old AM radio. (Am I dating myself?) The Signal is this case is quantitative data that can be used, with confidence, to make decisions, in all areas of the enterprise from technical to commercial, and manufacturing and supply chain to quality systems. The Noise in the case is the universe. The noise is all the contributors to background chatter. Examples are everything from suppliers who don’t produce your parts correctly, to uncalibrated test and measurement equipment giving you inaccurate information, to customers who change requirements without notification, to sales guys who sells a thing that can yet be produced, to well-meaning advice givers. These sources of noise can cause the enterprise to make uniformed decisions, without fully understanding the risks associated with those decisions.

It's not always easy to discriminate between the signal and the noise, particularly in the earliest stages of startup founding and product design. The ability to detect what is noise should improve significantly over time as your mission and design processes become clearer, resulting in an actual reduction of noise.

t1 - t10 represent time periods over a technology’s or product’s development; Percentage of Cumulative Performance represents the actual product’s performance considering the combination of the product’s design, manufacturing, test and reliability against actual customer requirements

For now, t1-t10 on the horizontal axis will represent development and operational steps.  Later I’ll relate these to product life cycles.

How do we determine noise acceptable noise level, or in measurement talk the discrimination level, to feel confident that you are making decision with known risk and the best available quantitative data? And note, the best available might be all you have as a startup executive or manager.  

The answer is that you characterize them using best practices, to distill all factors down into two buckets, Critical to Function (CTF) Parameters and Product Limiting Factors (PLF).

Critical to Function (CTF) Parameter

  • A subset of a product’s specified parameters that are critical to its performance

  • CTF’s may be limited by material performance or availability, process technology and capability, supply chain capability, intellectual property restrictions, industry allocation (IC’s in 2021),

  • These may be known or still need to be discover during product, process, and test development

Product Limiting Factor (PLF)

  • Of the CTF Parameters, these are the 5-10% of the CTF, if not solved, will keep a product from achieving its potential. This causes:

  • Failure to meet time to market, volume, or profit targets

  • Failure to meet yield and economic goals

  • Failure to achieve the desired reliability necessary for successful adoption of the product or service

Risk and “the Unknowns” will always be present but their impact can be minimized if CTF and PLF are identified sooner than later.

A hard-tech entrepreneur needs to be comfortable with the knowns and unknowns. Once something (parameter, process, material recipe) is better understood and is heading toward a Known, control it and make sure it can be realized repeatably and sustainably, and at a sufficient level of control to ensure it never bothers you again. If the parameter keeps sliding back into instability, or has a disproportionate impact on performance, it might a CTF. These need special attention.

Again, there are reams of materials on traditional metrology and process control out there. I’ll touch on some useful content but will more likely present hyperlinks to such material as concepts are introduced.

In closing, startups are being funded for a breakthrough in technology, services, or systems. They are not being funded to recreate what’s been used as best practices and methods. If it’s public, use it. The art and science is to take what you need from what’s been used before and derive it to your ends applying it to where you are in your Product Life Cycle. But again, that’s the next blog chapter.

The Structure and Culture of your Startup

Understanding and adapting your organization’s structure
(Post 2)

This chapter will begin our focus on one of the four areas that are critical to the success of your startup venture: the structure and culture of the venture itself. Part of this organization is the design of the team (team members, roles, decision making process) and part is the infrastructure of the corporate entity (an LLC, a subsidiary of a larger organization, among many options). But many start up organizations, regardless of industry, size, and experience of leadership, seem to exhibit many of the same characteristics, behaviors, and constraints, and this chapter will delve into these commonalities, and how they may be affecting the forward motion toward meeting your startup’s goals.

Arc Completa’s Critical to Function Key Factors

Most startups have a set of attributes in common, some of which tend to favor progress (“Moving Forward”), and some of which tend to have the opposite effect on progress (“Holding Back”). Notice I don’t use positives and negatives because these are absolute terms. If we start getting comfortable this early with absolute states when talking about startups, we are already feeding into one of the mistaken paradigms that plague many start up leaders: believing you know the answers, without the doing the work to prove the answer is correct. Part of this journey will be to know and accept that you don’t have all the answers, but you have the confidence, insights, skills, and the team to find them.

What Moves Startups Forward

  • “Green Field” in many ways

    Many startups are working on a new project or creating a new system, where there is no legacy system in place to work around.

  • No Dogma, Intractable Culture, or Inertia

    Some of the things that slow progress in an established organization – historical limitations or cultural habits of the workforce – tend to be absent in a startup.

  • Maverick and high output producers

    Most startup workforce members are risk takers, willing to think outside the box, highly productive and motivated.

  • Desire for Profit and urgency are present

    Team members are on the same page and working together to find profitability as quickly as possible.

  • Inexperienced workforce that can be firmly molded

    This risk-taking workforce is sometimes younger and/or less experienced, with fewer bad habits and/or attitudes that may slow down progress.

  • Fast Moving

    The technologies and work tend to move forward quickly.

  • High Return Potential from investment

    If you’re first to Market and Profitability, significant profits and long term sustainability are possible via a purchase or Initial Public [stock] Offering (IPO).

What can Hold Startups Back

  • Many Degrees of Freedom and Unknown Risks

    Defining a new market segment or disruptive technology can be difficult – too many options, with the potential to define a challenge that is unrealistically large or intractable.

  • Relying on research methods instead of commercial methods

    The leap to commercialization can be deadly. The technology that worked flawlessly on the lab bench has a whole new set of challenges when trying to grow, increase stability, reduce costs, and meet the other challenges that going to market introduces.

  • The “Entrepreneurial Myth” can defocus resources and hurt a company’s potential

    Startups may be young, small, and agile, but small companies, particularly startups, neglect the organization and system norms of larger companies rely on, often stating “…we don’t need big company methods to hold us back”.

    Basic organizational structure, design processes, structured problem solving, and effective communication around expectations and desired outcomes can be seen as unnecessary big-company bulk, but their absence can be even more costly.

  • Founder-itis, or the outsized impact of the founder

    The strong personality and confidence often found in an entrepreneur or innovator can be a liability for taking a startup to the next phase of growth. “Founder-itis” or the founders’ dominant behavior can compound the Entrepreneurial Myth with lack of formal training. In addition, there can be a temptation to keep the founder in a top level leadership position even when the requirements of the organization change.

  • Startup leaders often lack of formal leadership training, coaching and suitable mentorships

    Many startups do not value basic leadership and management methods. Often siloed decision making, where decisions and goals are not communicated well across groups, can dampen creativity and eliminate possible solutions. Time and resources are limited, making formal decision making processes and communication seem like secondary requirements (but they are not!).

  • Losing sight of primary Goal

    Once the venture is founded and the goals of moving forward are established, the prime directive is not making the new technology or invention better (“technology for technology’s sake”), but rather, commercializing Products or Services, and establishing a market and demand for them.

    Achieving an exit, maybe a purchase or IPO, while delivering a satisfactory return for investors and company employees, is the new goal for everyone on the team.

  • Lack of appropriate guidance and understanding from investors

    Investors to a new venture are often ignorant of the actual market requirements or lack experience to guide the startup. If this is the case, founders cannot effectively communicate status and risks to the board of directors and investors. The founders may fear delivering bad news, instead feeling confident in delivering structured and accurate progress reports. The startup community may lack the experience to “Train” the Board of Directors on what to expect.

  • Using old methods to solve problems when new innovation is required

    Team members may do basic research or a literature search to solve problems that come up based on previous job experiences. Using tried-and-true methods can be helpful, but does not always apply to emerging technology to solve their problems. A new and innovative approach may be better suited to solving problems.

  • But also: the risk of “Not Invented Here” bias

    There are times when new and innovative approaches may be merited. But it is also important to reuse, borrow, outsource methods and solutions if there is a reliable, tested, established precedent that can fit into your process.

  • Low or no Consistent Production Quantities

    Sometimes, with limited resources and time, teams tend to build a minimal quantity of test or pre-production goods. But this may mask issues that may arise when building a larger quantity. A larger company would use a higher yield production to increase understanding of critical requirements and build product knowledge. Can you build enough products to demonstrate performance?

  • Discounting the value of early production builds

    Each build or production run is the right time to create collective knowledge base, but infrastructure is often absent and unable to collect critical data and to make decisions. Every build counts; from the earliest production runs, detailed data is key.

  • Failing to understand what the total commercialization potential might be

    When a startup is so focused on one solution, they can miss other opportunities that might be more easily attained commercially. Use contacts in other industries or market segments to consider other commercialization potential.

  • Poor capital usage and estimates

    The fear of asking for “too much” and underestimating the complexity and cost of the tasks at hand, the initial capital request is insufficient. Not only does that put the venture at risk of running out of funding, but this can affect credibility and cause the board of directors to question future requests. Be realistic, even generous, with time and resource estimates.

In this first chapter I discussed some thoughts about the nature of a startup, some constraints, and behaviors. In later chapters I will discuss some thoughts and questions raised by the Moving Forward and Holding Back topics, and how a startup might tackle these quantitative and qualitative, cultural, and behavioral challenges. But addressing some foundational areas discussed in the next few chapters is more urgent.

So why do so many people want to create a Startup?

So why do so many people endeavor and launch startups? The risks are significant but the potential upside is unmatched - the sense of accomplishment, the ability to change an industry or change the world, the financial reward. As a startup executive, it was the best work experience of my long career, with some of the most brilliant, innovative, and dedicated people I’ve ever hired and worked with.

Why do companies want startups to succeed? Larger companies look at startup acquisition as a way to avoid risky technology development investment, by buying aligned products already developed. Contract manufacturers need startups as well. Why? As my friend Dr. Teera Achariyapaopan, the previous COO of Fabrinet, Ltd,. and now the founder and CEO of Focuz Manufacturing (http://www.focuz-mfg.com/) explained, “while larger customers might grow 2-3% a year in sales, a successful startup could add a 10% increase to our sales in sales in 1 year.”

In this first chapter I discussed some thoughts about the nature of a startup, some constraints, and behaviors. In later chapters I will discuss some thoughts and questions raised by the Moving Forward and Holding Back topics, and how a startup might tackle these quantitative and qualitative, cultural, and behavioral challenges. But addressing some foundational areas discussed in the next few chapters is more.

Prologue: Not ANOTHER Startup Blog...

Why write a blog about emerging technology commercialization? (Post 1)

There are lots of blogs out there with advice and commentary on driving forward business ventures, and plenty of sources of guidance and case studies on commercializing new and emerging technologies. These sources can be helpful and achieve results; however, they often are very specific to an individual industry or vertical market, with limited applicability across a wider range. They may also recommend useful tools and models but inserting your organization into these models may cause you to misidentify the issues that are most pressing to your case.

A flexible approach is needed, broad enough to capture a wide range of possible emerging technologies, but specific enough to provide real solutions. An approach that does not assume what the right answers are, but instead finds the areas that are the most critical in your venture. The key is identifying the problems that need to be solved, not solving them before identifying them.

What can I add to this body of work, and why am I the right source to provide insight to the next entrepreneur ready to launch a commercial venture? I could list my personal credentials and achievements by way of introduction or produce lots of facts and figures. But instead, I will approach this blog using a communication style I have learned as an executive coach: Instead of trying to sell what I’ve learned, this blog will take on a coaching approach, one of a mutual journey of discovery and sharing.

How are we going to approach the discussion?

Arc Completa’s Critical to Function Key Factors

My methodology covers four key areas for any emerging technology venture. These Critical to Function Methods rely on focusing on these factors that are considered in parallel; success requires all of these areas to be tended carefully and simultaneously. The blog will use the above diagram as a touchpoint, highlighting which of the four keys is the highlight of each blog entry. These areas are:

Organization and Structure

The first area I will discuss is the organization and structure of your venture – the actual infrastructure of the team. Is it an independent startup organization? A sub-team acting independently within a larger company? Who are the key players and how is the team organized in terms of hierarchy, job titles, decision makers? Is the structure right for the venture today, and how will it need to be adjusted as the organization proceeds through your plan?

 Commercialization

This area describes the emerging technology/product your venture is creating, and how it will be designed, produced, tested, scaled up, marketed, priced, and supported. What is the ideal initial product to be launched? Who are the target customers? Transitioning from lab to market encompasses a wide range of challenges that must be anticipated and faced with a clear plan and constant attention.

 Supply Chain and Outsourcing

This area encompasses both the traditional definition of supply chain, describing where raw materials will be acquired and how your end product will be fulfilled, but also areas of potential outsourcing for services such as aspects of design and marketing, as well as  manufacturing. Conserving resources, and making sure the wheel is not being reinvented, is key.

Time to Profit

Finally – and critically – there is the all-important funding question. How long can your venture proceed without profitability? What are the options to continue funding in case of unexpected limitations in other areas?

In the first chapter, I’ll discuss some thoughts about the nature of startups, along with typical constraints and behaviors that influence the growth and progress of a startup. Most startups have a set of attributes in common, some of which tend to favor positive progress (“Moving Forward”) and some of which tend to have a negative effect on progress toward the goal (“Holding Back”). In later chapters I will discuss some thoughts and questions raised by the Moving Forward and Holding Back topics, and how a startup might tackle these quantitative and qualitative, cultural, and behavioral challenges.  However, some foundational areas are more urgent, and need to be addressed in the next few chapters. 

After establishing some of these properties and behaviors you may recognize in a startup organization, the blog will present some straightforward methods to moving toward your goals that any startup can use.  Some of the technical content is more focused on hard-tech startups, but service-based startups can benefit from much of the content as well.  I’ll also share some real experiences, that I’ve sanitized to protect confidentiality, that might put into perspective what I’m discussing.

What is the goal here?

Startups and new ventures generally have a desired end point, whether that’s an IPO or a purchase. My goal is to share methods I believe can improve the likelihood that a new venture will reach its goals. I want to leave room for all types of startups to find value, and for ventures of all sizes to enjoy the experience of creating positive customer experiences. 

 Our methods answer questions that are often asked.