
The Process Behind the Process
Part 2: Using your Multivariable Process Map to Drive Next Steps (Post 9)
The previous several blog entries have delved into the nitty gritty of the Multivariable Process Map; by now you are fully aware that we consider this a key tool in building and refining the manufacturing process of a new product. We wrapped up the last entry detailing the workshop-style meetings that serve to establish and flesh out each step in the Process Map, describing the meetings in sets of “Part 1” and “Part 2.” This entry will go through the Part 2 meetings: validating the content that was created in the Part 1 meeting, closing outstanding actions, and launching into the next block of processes. I prefer using the Whiteboard approach for Part 1’s, as it’s more organic and engaging with the stakeholders. Some folks prefer building the process maps in Excel during workshops. It’s really a matter of style, and the flow is basically the same after the capture.

Metrology: measuring quality throughout the manufacturing process
Before we attack Part 2, let’s chat about Metrology and Test & Measurement. Most products need to meet a set of requirements that the customer desires or are described in a product’s specification. In most manufacturing operations, a product’s quality is not “inspected” at the end of the production line. Rather, the quality of the product is confirmed and measured throughout the manufacturing process: it is progressively created through inherent process capability, a process’ natural ability to create conforming product or components, and in-process inspections and measurements of CTF Parameters because they control performance outcomes.
If each transformation or move has Inputs, Process Steps, and Outputs, Metrology is the means of measuring the quantitative “How Good?”.

We’ll discuss in a future entry the balance of process capability, contrasted to design rule paradigms’ ability to realize design intent. My experience is that emerging technologies are highly reliant on metrology until experience is gained through production.
The Part 1 and Part 2 meetings
The Part 1 meeting establishes and fleshes out a designated block of operations or process steps. You’ll figure out how many can be handled in a meeting. The Part 2 reviews those same steps – the next set of steps will be in a subsequent set of meetings – and fills out any blanks. Individuals who had action items to review or dig up data can share, and any conflicts or questions from the Part 1 meeting can be resolved.
Part 2 – Review, Actions, Reconciliation, and filling in missing blanks if possible
Show the team the shared directory and where to put content. Encourage electronic versions.
Plan for the first 20 minutes to be consumed reviewing the actions and activities to tighten up Part 1’s results. This can be completed in Excel, and stakeholders should have their information ready. This may or may not happen in the first couple of rounds, until they figure out you’re not going away and will bother them mercilessly.
Get agreement that these designated blocks are as complete and filled out as much as possible and launch or schedule Part 1 on the next designated blocks.
Use the balance of the meeting to capture the content and repeat the workflow.
Identifying and including sub-processes and ancillary activities
As you work through your first process map, you may discover ancillary or supporting activities that are completed with little notice, out of habit, and as regularly scheduled activities. These activities are important and can be handled in multiple ways; the key is that you have identified and thought through how they will be handled in your model (and in your manufacturing process!). You might also get bogged down realizing that process activities are being carried out offline in preparation for the main process, and or delivered, as a whole, to the process from an internal or external subcontractor.
Sub-Processes: What do you do with ancillary or supporting activities identified during the mapping sessions? These would be, for example, regular calibration and maintenance of shared or existing equipment, certain grades of gases and common chemicals that are standard and might impact performance, and chemical expiration date management and control. Ancillary and supporting activities might not be their own process map but can be captured in the "Touch" Work, Settings, Specs section as something critical. For example, if a regular calibration improves performance, state: “Calibration verification required before use”. If there are four “identical” systems, but System 1 is always used, state: “Use System 1 only”. If shared chemicals are bought to control the process, make sure you control the expiration dates and purity, minimally in the Consumables, state: “IPA, 99.999%, closed glass container”.

Subassemblies, Preparations and Kitting: All of these activities can be phantoms until a process mapping session is underway. Often when you take a step back, you realize they are their own process maps. And why not?!? You, as the curator, advocate, and champion of the process map, have to decide if a subassembly, preparation process, or kitting is best served within the body of the main process map, or spun out as its own thing. Examples of activities that may be discovered in the process may include:
Subassembly: An automobile’s motor, transmission, and dashboard are examples of subassemblies. Economically it makes sense to assemble these components to a point and add them to the final product in this state.
Preparations: In chemical processing, often a final formulation will be made up from many simpler formulations that MUST BE ready and available during processing. These preparations are often highly controlled, created and presented to the process in specific states and conditions.
Kitting: Kitting are activities associate making sure certain components, subassembly, and preparation are “picked” and presented to the process to increase efficiency (not to have to waste time running around looking for stuff) and to increase accuracy (making the right stuff in the correct quantity or amount). Sometimes kitting is required because of time or perishability considerations. For example, if Formula 1 requires Part A at 50°C and Part B at 40°C and aged for exactly 1 hour while stirred, kitting these materials to supply them in the correct state is required. In single piece flow or “Just in Time” manufacturing, kitting is an artform and a highly refined process, enabling rapid product of highly complex systems.
The Bigger Picture: The Multivariable Process Map in context
We’ve spent quite a bit of time at ground level, describing the progression and advancement of your Process Maps as they quantify and detail the manufacturing process. Let’s take in the view a couple thousand feet higher in perspective. Where does this model fit in to the bigger picture? How do we use this information to drive and validate the next steps in our development and commercialization of the product we have in mind?
We see emerging technology commercialization as a four stage business process, with Multivariable Process Maps as stage 1.
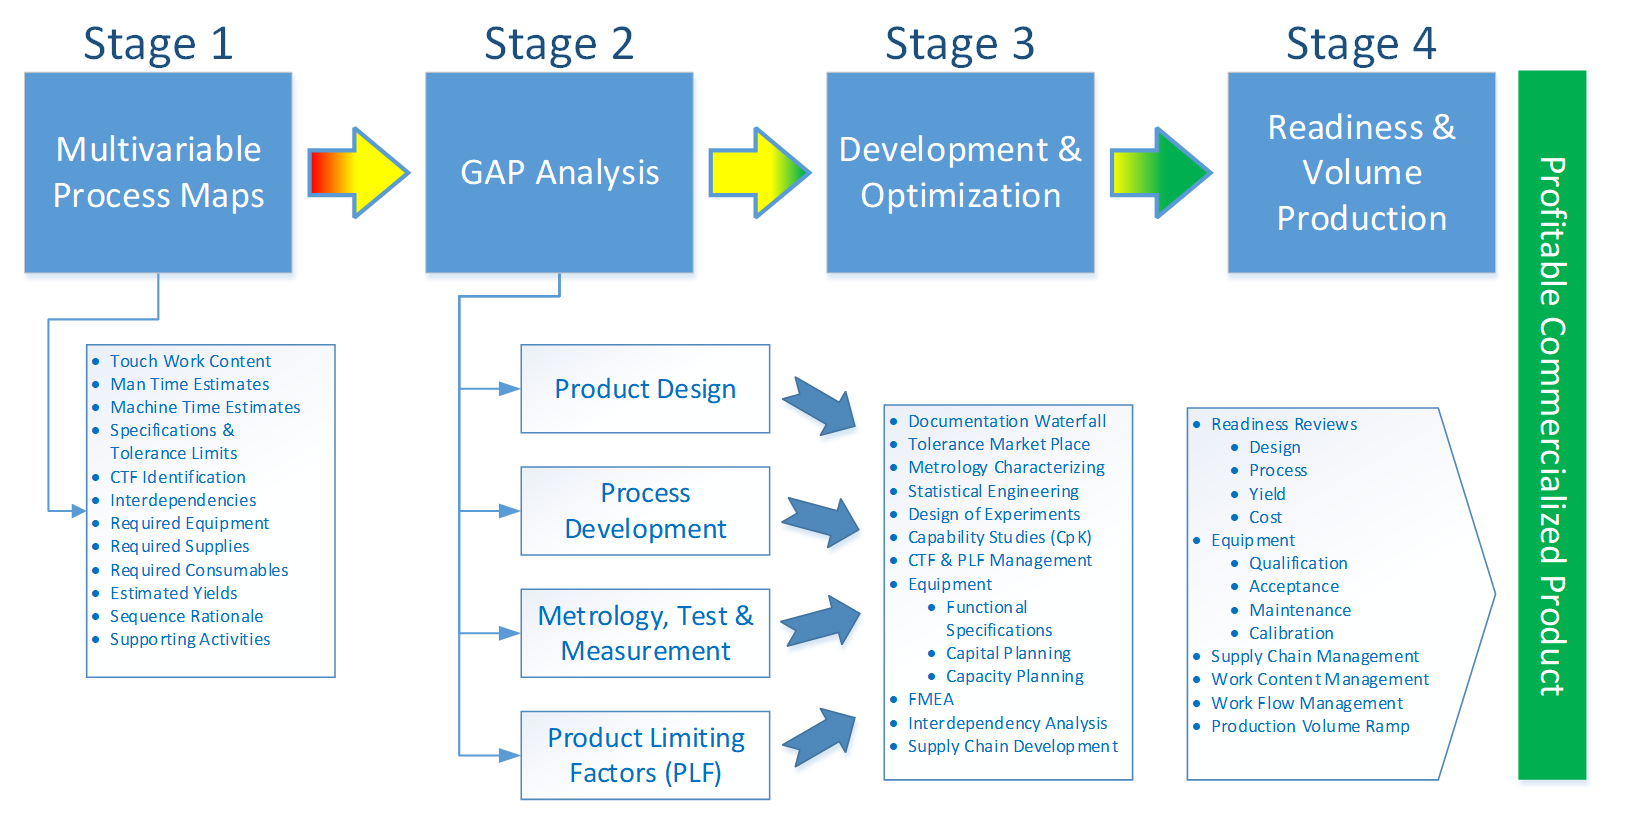
Commercialization Stages
This might seem a bit overwhelming. Yes, it’s a lot of work. (And this is boiled down for startups.) You eventually want to ship something your customers want to buy, and you want to be a desirable company for acquisition or to go public through an IPO… there’s not an alternative to putting the work in up front (and also throughout each step). Hard-Tech is HARD. It’s not software, where bugs are fixed with the next release. Hardware startups have higher risk, high investment in equipment, and in general, a higher likelihood of missing the target customer’s needs.
Stage 1 is the foundation, the work and all the parametric content that rolls up into your product. The process mapping journey you’ve undertaken is the first stage, and the fundamental study and knowledge acquisition of your How that will achieve your What. I think I’m going to pause at Stage 1, because to complete a company’s first process map is often an intensive experience. The process map will create questions, and will often work to shore up beliefs and bring light to uncertainty. I’m going to discuss and explore some underlying thoughts and methods, often used by larger, more established companies during Stage 2, Gap Analysis. These methods will help clarify background and desired outcomes for Stage 2, by adding tools to your toolkit for contrasting risk and capabilities to product realization.
But before we get into Stage 2, we’ll pause for a few entries dedicated to the Time To Profit thread of our blog. (There’s a lot to think about simultaneously! Your tech guys have a lot of Process Mapping to do; it’s time for the leadership team to be thinking about profitability again.)


Full Arc Posts Table of Contents
Post 4 - Defining Product Requirements
Post 5 - Exploring the Product Life Cycle
Post 6 - Understanding Risks in Real Time
Post 7 - A Deep Dive on Process Modeling
Post 10 - Looking into the Future
Post 11 - Keeping an Eye on The Next Generation
Post 12 - Product Platforms